How Much Can You Really Make on Airbnb?
It's the first question almost every owner asks, and it's also the one that gets answered the worst. Search around and you'll find confident headlines promising a single national average, as if every property in the country earns the same amount. The honest answer is that Airbnb income lives on a wide range, and where your property lands depends on a handful of variables you can actually measure.
A spare room in a slow market might clear a few hundred dollars a month. A well-run four-bedroom near a national park can gross six figures a year. Both are "Airbnb income." Averaging them together produces a number that describes neither.
This guide breaks down the math that actually drives host earnings, what separates gross from net, the expenses that quietly eat into your take-home, and how to estimate the realistic potential of your specific property, without the hype.
The Core Formula: How Airbnb Revenue Is Built
Every dollar of short-term rental revenue comes from the same simple equation:
Average Daily Rate (ADR) × Occupancy Rate × Nights Available = Gross Booking Revenue
That's it. Everything else is a lever on one of those three inputs.
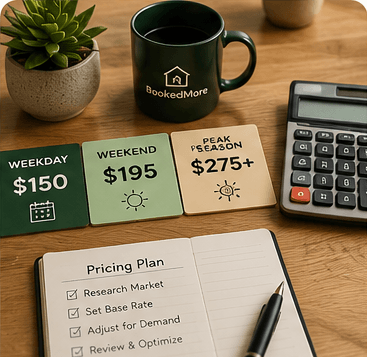
- Average Daily Rate (ADR) is your average price per booked night. Nationally, ADRs commonly fall anywhere from roughly $120 to $350+, but the spread is enormous: a studio in a budget market might average $130, while a mountain cabin in a premium destination can clear $800 a night in peak season.
- Occupancy rate is the share of available nights that actually book. Across the U.S. short-term rental market, average occupancy has hovered around 50-55% in recent years as supply has grown, though strong operators in healthy markets routinely run well above that.
- Nights available is how many nights you actually offer. A property you rent year-round has roughly 365 nights to work with; a part-time rental or one with long owner stays has far fewer.
The trap most owners fall into is optimizing one number while ignoring the others. Raising your nightly rate feels like more money, but if it drops occupancy enough, your total revenue falls. The goal is never the highest ADR or the highest occupancy in isolation, it's the combination that produces the most total revenue. That balancing act is exactly what dynamic pricing is built to solve.
Gross vs. Net: The Number That Actually Matters
Gross booking revenue is the headline figure, the total guests pay before anything is deducted. It feels great, and it's also misleading, because you never keep all of it.
Net income is what lands in your account after every cost is paid. The gap between the two is wider than most first-time hosts expect. Depending on your market, property, and how you run it, your net margin, the share of gross revenue you actually keep, typically falls somewhere between 15% and 35% for self-managed owners who account honestly for every expense. When a full-service manager is involved, that margin compresses further on a percentage basis, though a good one often grows the gross enough to more than offset their cut.
Here's a simplified, illustrative example for a single mid-tier property over a full year. Your numbers will differ, but the structure holds everywhere.
| Line Item | Annual Amount |
|---|---|
| Gross booking revenue | $52,000 |
| Airbnb host service fee (approx. 3%) | -$1,560 |
| Cleaning costs | -$6,500 |
| Utilities and internet | -$3,600 |
| Supplies and restocking | -$1,800 |
| Repairs and maintenance reserve | -$3,100 |
| Insurance | -$1,500 |
| Software and listing tools | -$600 |
| Net before mortgage and taxes | $33,340 |
Notice what this example does not include: your mortgage or rent, property taxes, and income taxes. Those are real and often the largest line items of all, but they vary so much by owner that lumping them into an "average" is meaningless. The point of the table is to show how a $52,000 gross becomes roughly $33,000 in operating profit before financing, and why the gross number alone tells you almost nothing.
The Expenses That Eat Into Your Earnings
Understanding where the money goes is the difference between a property that looks profitable and one that actually is. Here are the costs every honest projection should include:
- Cleaning and turnovers. Often your single largest operating expense. Even when guests pay a cleaning fee, busy turn schedules, deep cleans, and laundry add up.
- Platform fees. Airbnb's host-only service fee is commonly around 3% of the booking subtotal, though the exact structure varies by listing.
- Utilities and connectivity. Electricity, gas, water, internet, and streaming. Higher in extreme climates and larger homes.
- Supplies and consumables. Toiletries, coffee, paper goods, and the small replacements that quietly recur every single month.
- Repairs and maintenance. Wear and tear runs faster on a short-term rental than a long-term lease. A reserve of 5-10% of revenue is a sensible buffer.
- Insurance. Short-term rental or commercial coverage costs more than a standard homeowner policy, and you need it.
- Furnishing and setup. A one-time but real upfront cost that should be amortized when you judge returns.
- Local taxes and permits. Occupancy taxes, licensing, and registration fees vary widely by city and can change the math meaningfully.
- Management or co-hosting. If you don't do the work yourself, someone has to, and that has a cost, whether it's your time or a professional's fee.
If you want plain-language definitions for any of these terms, the short-term rental glossary breaks them down.
What a "Good" Return Actually Looks Like
There's no universal target, but a few honest benchmarks help you judge whether a property is performing.
- Net operating margin. After operating costs but before financing, many well-run rentals keep 25-40% of gross. Below that, something in the cost stack usually needs attention.
- Occupancy. Beating your local market average is a clearer signal of health than any national figure. A property running 78% in a market that averages 55% is genuinely outperforming.
- Cash-on-cash return. For owners who financed the purchase, comparing annual net cash flow against the cash you actually put in is the cleanest measure of whether the investment is working.
- Revenue per available night (RevPAR). ADR and occupancy combined into one number. It's the single best metric for comparing two properties or tracking your own over time.
A "good" return is one that beats what the same capital and effort would earn elsewhere, after honestly accounting for your time. If a property nets less than a long-term lease would after all the extra work, that's a signal worth taking seriously.
How Location, Property Type, and Management Change the Math
Three factors move the numbers more than anything else.
Location
Location sets your ceiling. Nightly rates, seasonal demand, regulations, and competition are all functions of where the property sits. A beach town and a suburban neighborhood with identical homes can produce wildly different revenue. Before you model anything, know your local demand and your local rules, since some cities cap or ban short-term rentals entirely. Our service areas page is a useful starting point for seeing where short-term rental demand is active.
Property Type
Property type sets your scale. Entire homes consistently earn multiples of what a private room brings in, and each additional bedroom typically adds meaningful nightly value because it expands the guest pool. A unique feature, a hot tub, a standout view, a pool, walkable location, can lift both your rate and your occupancy at the same time.
Management
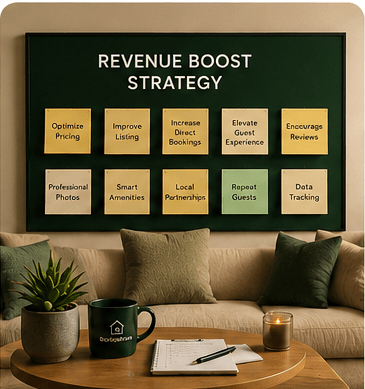
Management sets how close you get to your property's true potential. The same home can earn dramatically different amounts depending on pricing strategy, listing quality, review scores, and response times. This is where most of the gap between an average listing and a top performer actually lives, and it's the variable you have the most control over. Strong listing optimization and consistent guest communication routinely separate the top quartile from everyone else.
How to Estimate Your Property's Potential
You don't need to guess. Here's a realistic, repeatable way to pressure-test a property before you commit.
Start With Comparable Listings
Find active listings in your area that genuinely resemble yours, same bedroom count, similar quality, same neighborhood, and study their calendars, rates, and review volume. Review counts are a rough proxy for how often a place actually books.
Build a Conservative Revenue Estimate
Multiply a realistic ADR by a realistic occupancy across the nights you'll actually offer. Use your market's average occupancy, not a best-case number, and run a low, middle, and high scenario rather than betting on a single figure.
Subtract a Full Expense Stack
Use the expense list above and resist the urge to round costs down. The most common mistake in DIY projections is underestimating cleaning, maintenance, and vacancy. A projection that survives honest expenses is one you can trust.
Run the Numbers Through a Tool
Rather than building spreadsheets by hand, our Airbnb revenue calculator lets you plug in your specifics and see a grounded estimate based on real market data. It's the fastest way to move from a vague "how much can I make" to a number you can plan around. If you're brand new to all of this, the first-time Airbnb host guide walks through the fundamentals first.
Where Management Moves the Number
Every variable in the core formula, your rate, your occupancy, your review scores, is something a professional operator works on every single day. That's the entire point of performance-based management.
At BookedMore, we run active management across a growing portfolio nationwide — keeping listings priced to demand and guests looked after around the clock. Managed listings are driven by dynamic pricing, professional listing optimization, 24/7 guest communication, and tightly coordinated turnovers — the fundamentals that lift revenue.
Our model is performance-based: a percentage of booking revenue, with no flat fees and no setup fees. We only do well when your property does, which keeps our incentives pointed at the one number that matters most to you, net income. You can see the full scope of what's included on our services page, review the pricing structure, and look at real outcomes on our results page.
The Bottom Line
So, how much can you make on Airbnb? Realistically, anywhere from a modest side income to a serious six-figure business, depending on your ADR, occupancy, nights available, property type, location, and how well the whole operation is run. Anyone quoting you a single national number is selling certainty that doesn't exist.
The healthier way to think about it: estimate conservatively, subtract every real expense, judge your return against honest benchmarks, and focus your energy on the variables you control, pricing, presentation, and guest experience. Do that, and the income takes care of itself.
If you'd like a grounded, property-specific projection instead of a guess, get a free revenue estimate and we'll show you what your place could realistically earn.
Ready to put this into practice?
Get a free property analysis and see exactly what your listing could be earning.
Get My Free Revenue Estimate